Dominance Debrief #18
ETHDOM surged +2.60% as soft CPI revived risk appetite and ETF inflows returned; BTCDOM added +0.49%. USDTDOM, BNBDOM, and SOLDOM all lost share, a narrow rotation, not a broad one.
THE DOMINANCE DEBRIEF
Week of July 13 – July 19, 2026
Issue #18
TL;DR: ETHDOM surged +2.60% as soft CPI revived risk appetite and ETF inflows returned; BTCDOM added +0.49%. USDTDOM, BNBDOM, and SOLDOM all lost share, a narrow rotation, not a broad one.
1. THE WEEK IN DOMINANCE
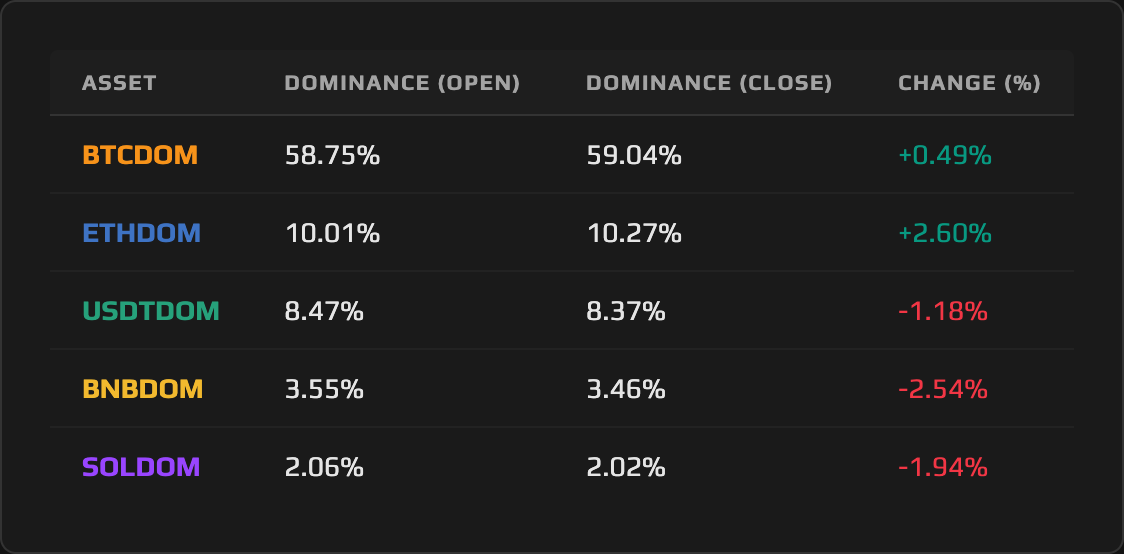
Ethereum Dominance did the heavy lifting this week, gaining 2.60% to reclaim ground above 10.00% and finish at 10.27%. Bitcoin Dominance also advanced, up 0.49% to 59.04%, holding its position as the largest share of the total market. But the risk appetite that lifted those two majors did not spread further: Tether Dominance fell 1.18%, BNB Dominance fell 2.54%, and Solana Dominance fell 1.94%. The defining story of the week is not that risk-on returned to crypto. It’s that risk-on returned to exactly two assets, and left the rest of the complex behind.
2. MACRO CONTEXT — THE BACKDROP
The total crypto market cap moved from roughly $2.16 trillion to roughly $2.18 trillion, an estimated gain of about 1.0%. That growth was not evenly distributed. It concentrated almost entirely in the two assets that gained dominance this week, which is the throughline for everything that follows.
The week opened in risk-off mode. Renewed hostilities between the US and Iran on Monday spiked oil prices and revived inflation fears, pulling BTC down near $62,000 and ETH near $1,766 in the early hours; that dip is the source of ETHDOM’s 9.95% weekly low. The mood reversed hard on Tuesday when June CPI came in soft across the board: headline inflation fell 0.4% month-over-month against a consensus of -0.2%, the biggest monthly decline since April 2020, driven by a 5.7% drop in energy prices. Core CPI was flat at 0.0% month-over-month versus a 0.2% consensus, with the annual core rate cooling to 2.6%. The print revived expectations for rate cuts later in the second half of 2026, even as CME FedWatch still assigned roughly 86% odds to a hold at the July 29 FOMC meeting. Newly confirmed Fed Chair Kevin Warsh delivered his first Humphrey-Hawkins testimony that same Tuesday and Wednesday, striking a firm anti-inflation tone that tempered how far the risk-on reversal could run. Sentiment improved but did not flip: the Fear & Greed Index climbed from the low-20s toward roughly 30 over the week, still sitting in Fear territory.
The overarching narrative is a rotation, not a broad risk-on wave. Capital that came off the Monday scare and the Tuesday CPI relief found its way into Ethereum and, in large part, Bitcoin. It did not find its way into Solana or BNB, and it left the stablecoin complex for the exits. That selectivity is the week’s real signal, and it’s why Ethereum Dominance is this week’s deep dive.
3. ASSET DEEP DIVE
Ethereum (ETH) Dominance
Open Price: 10.01% / Close Price: 10.27% / WoW Change: +2.60%
The Structure
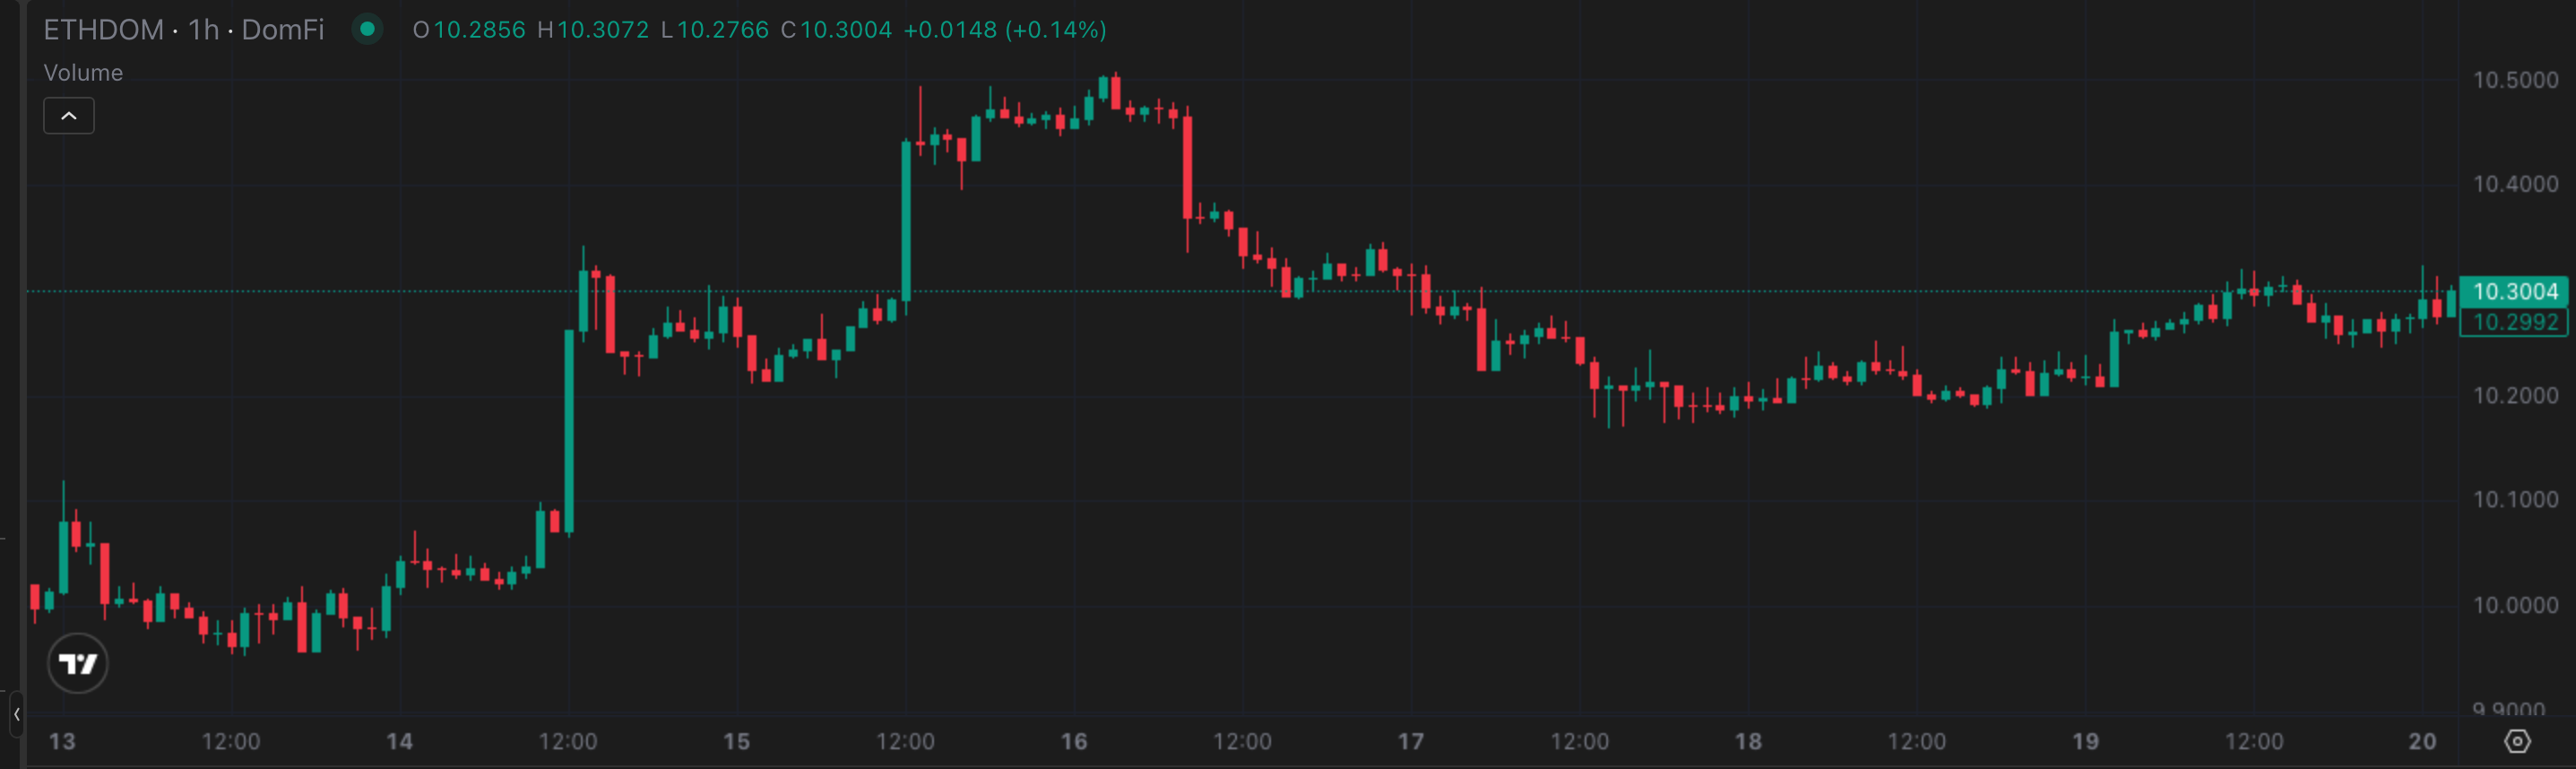
ETHDOM printed a higher-low, higher-high week: it opened at 10.01%, dipped to a low of 9.95% inside the first day, then reversed and expanded through the week to a high of 10.51% on Thursday. The 10.00% level functioned as the pivot the entire week; once ETHDOM reclaimed it Tuesday, it never traded below it again. That reclaim zone is now the level to watch on any pullback, and 10.50%, the intraweek high, is the level ETHDOM needs to clear and hold to extend the move.
This Week’s Price Action
The weekly candle tells a clean story of a failed breakdown turned into an expansion. ETHDOM opened, deviated lower on the Monday risk-off flush, and then spent the rest of the week working back above the open and closing 2.60% higher than where it started. The bulk of the gain built midweek, which is exactly when the macro backdrop flipped from fear to relief. Dominance did not just track the reversal in sentiment; it outran it, closing well above the pre-dip open rather than merely round-tripping back to flat.
The Daily View
Monday carried the risk-off dip to the 9.95% low as the Iran headlines hit. Tuesday and Wednesday saw a steady climb as the soft CPI print worked through the market. Thursday, July 16 produced the week’s peak at 10.51%, the sharpest single session of the run. Friday faded back to roughly 10.19%, a pullback that lines up with Warsh’s hawkish testimony still working through positioning and some profit-taking ahead of the weekend. ETHDOM recovered over the weekend to close at 10.27%. The daily view broadly confirms the weekly narrative of returning demand for Ethereum specifically, though Friday’s fade is a reminder that the move is not a straight line, and that the hawkish counterweight from the Fed is still in play.
The Why
This is a catalyst-to-flow-to-dominance chain with two distinct legs. The first leg was macro: Monday’s Iran-driven risk-off gave way Tuesday to the softest CPI print since April 2020, which reopened the door to risk assets broadly and lifted the total market by an estimated 1.0% on the week. The second leg is what made ETHDOM’s move larger than the market’s own expansion: capital did not just return to crypto, it returned specifically to Ethereum. Spot Ether ETFs broke an eight-week streak of net outflows, pulling in roughly $96 million across the first three sessions of the week, concentrated heavily in BlackRock’s low-fee fund, with a $36.7 million net inflow on July 18 alone and more than $84 million in aggregate inflows for the week. Alongside the ETF bid, Robinhood Chain, the Ethereum layer-2 that launched July 1 and settles gas in ETH, was processing more than $800 million a day in mostly memecoin volume, adding a structural source of ETH demand that has nothing to do with ETF flows and everything to do with the network’s own usage.
Those two channels, ETF-driven institutional demand and L2 gas-burn demand, are separate mechanisms that happened to point the same direction this week, and together they were a significant factor in ETH’s price rising 3.62% against BTC’s 1.46%. That gap alone was large enough to lift ETHDOM even before accounting for the total market’s own growth: ETH’s market cap grew faster than the total market grew, which is what dominance expansion actually requires. Warsh’s hawkish testimony was the caveat running underneath all of it, a reminder that this reversal happened despite, not because of, the Fed’s tone.
The Outlook
The bull case is straightforward: if the ETF inflow streak continues and Robinhood Chain’s volume holds, ETHDOM presses through the 10.50% high and extends the expansion into next week, particularly if Friday’s flash PMIs stay soft. The bear case centers on the July 29 FOMC drawing closer: a hot PMI print or a hawkish repricing into that meeting would revive the stablecoin bid across the market and stall Ethereum Dominance back toward the 10.00% reclaim zone, the level that would need to hold for the structure to stay intact. On balance, the combination of returning ETF flows and genuine on-chain demand from Robinhood Chain tips this toward continuation. ETHDOM presses higher before it retests 10.00%, with the July 29 FOMC as the swing event that decides which way it breaks.
4. THE DOMINANCE MATRIX
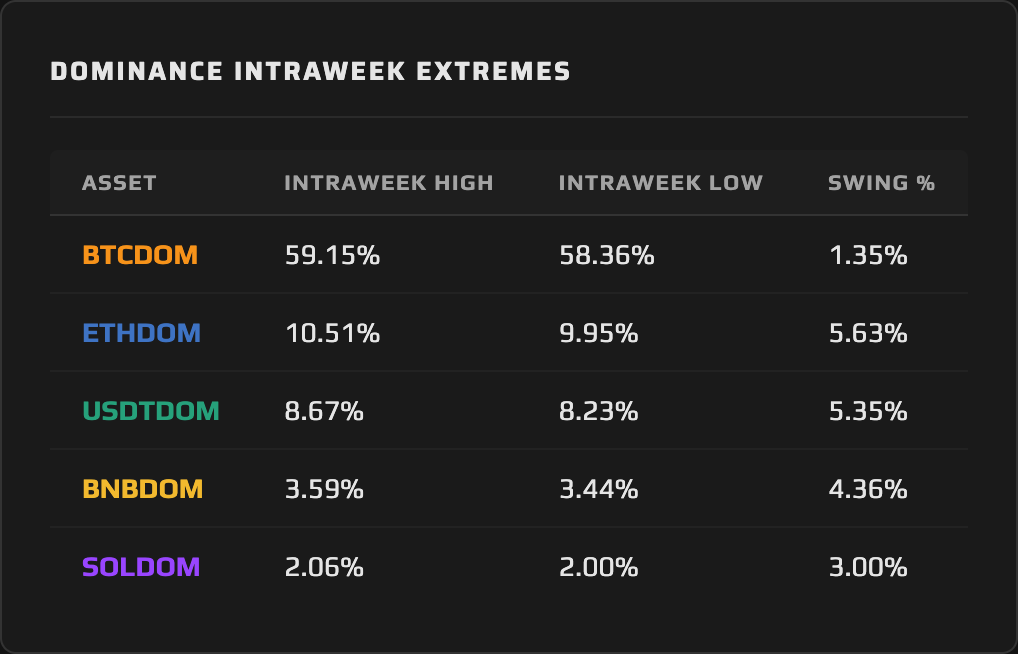
Bitcoin Dominance was the week’s other gainer, up 0.49% from 58.75% to 59.04%, and its intraweek swing of 1.35% (high 59.15%, low 58.36%) was the smallest of any pair on the board. BTC’s price rose 1.46% on the week, well behind ETH’s 3.62%, but that was still enough to add share because the market’s own growth wasn’t spread evenly across the rest of the complex. Where Ethereum Dominance did the volatile work of the week’s rotation, with a swing of 5.63%, Bitcoin Dominance barely had to move to capture its gain. It rode the center of the market rather than leading it.
Tether Dominance fell 1.18%, from 8.47% to 8.37%, and that decline is the healthiest signal in this week’s data: capital left stablecoins as risk appetite returned, which is exactly what a rotation week should look like. The raw supply figures confirm it. The aggregate stablecoin market cap, the entire category rather than Tether alone, contracted from $307.87 billion to $306.45 billion, a 0.46% decline. Dollars did not simply get diluted by a rising market, they actually left the stablecoin complex, which means USDTDOM’s retreat reflects genuine outflow and not just the arithmetic of everything else moving higher around it. Where those two readings could one day diverge, in the rotation between individual stablecoins, is exactly the depth a dominance lens trained on the stablecoin basket is built to surface.
BNB Dominance and Solana Dominance are the pairs that deserve the sharpest scrutiny this week. BNBDOM fell 2.54%, from 3.55% to 3.46%, with an intraweek swing of 4.36%. SOLDOM fell 1.94%, from 2.06% to 2.02%, swinging 3.00%. Both declines share a mechanism, not just a direction: BNB’s price fell 0.58% and SOL’s price fell 0.72% in absolute dollar terms even as the total market rose roughly 1.0%. Their market caps shrank while the total market grew, squeezing both dominance pairs from both sides at once. That is categorically different from what happened to USDTDOM, where the decline reflected capital actively leaving the pair. BNBDOM and SOLDOM didn’t lose a rotation; they were left out of one. The ETF inflows and the L2 gas demand that lifted Ethereum never touched either asset, and that absence, not the magnitude of the decline itself, is the real tell.
The full dominance picture this week describes a single regime: a selective, Ethereum-led rotation, not a broad risk-on move. Risk appetite returned, but it concentrated in ETHDOM and, to a lesser degree, BTCDOM; USDTDOM’s retreat confirms capital left the safety trade, while BNBDOM’s and SOLDOM’s shared decline, driven by outright price weakness rather than dominance math, confirms that same capital did not find its way to every major. The rotation was real. It just wasn’t broad.
5. THE WEEK AHEAD — EVENTS CALENDAR
Monday, July 20 — Starknet (STRK) token unlock: 175.4M STRK, 1.8% of total supply.
Wednesday, July 22 — Existing Home Sales, June (Consensus: 4.03M | Prior: 4.09M) | 20-Year Treasury Bond auction.
Thursday, July 23 — Initial Jobless Claims (Consensus: 228K | Prior: 221K) | Chicago Fed National Activity Index (Prior: -0.15) | 7-Year Treasury Note auction.
Friday, July 24 — S&P Global Flash US Manufacturing PMI (Consensus: 52.3 | Prior: 52.9) | S&P Global Flash US Services PMI (Consensus: 52.9 | Prior: 52.8) | New Home Sales, June (Consensus: 645K | Prior: 623K) | University of Michigan Consumer Sentiment, final July (Consensus: 61.8 | Prior: 61.8) | Deribit weekly BTC and ETH options expiry.
What to Watch for Dominance: The crypto calendar is genuinely light this week: the Starknet unlock is the only supply event of size, the weekly Deribit expiry is routine, and the larger monthly expiry doesn’t land until July 31. The real gravity sits just outside this window, at the July 29 FOMC, and Friday’s flash PMIs are the last meaningful data check before it. A continued soft-data, risk-on tone through Friday keeps USDTDOM pressured and lets ETHDOM press toward the 10.50% area it tagged this week. A hot PMI print, or any hawkish repricing ahead of the Fed decision, would revive the stablecoin bid across the board and stall the ETHDOM move back toward the 10.00% zone it just reclaimed.
6. CLOSING REMARK
The dominance charts this week tell a story about breadth, or the lack of it. Ethereum Dominance’s 2.60% gain and Bitcoin Dominance’s 0.49% gain look, on the surface, like a straightforward risk-on week. They aren’t. Tether Dominance fell as capital left the sidelines, which is the healthy part of that story, but BNB Dominance and Solana Dominance fell for a different reason entirely: their prices declined in absolute terms while the total market grew around them. The capital that came back into crypto this week had a specific address. It went to Ethereum, and it rode along with Bitcoin. It did not go everywhere.
That narrowness is the thing to track into next week. Ethereum’s move has real legs behind it, ETF inflows breaking an eight-week outflow streak and genuine L2 usage from Robinhood Chain, but a single week of concentrated leadership is not yet a market-wide regime change. The July 29 FOMC is the test that decides whether this rotation widens into something broader or reverts to a fear trade. Until BNBDOM and SOLDOM show signs of participating, the dominance charts are describing a two-asset story wearing a market-wide costume.
This content is produced by domination.finance for informational and educational purposes only. Nothing contained herein constitutes financial or investment advice. Always conduct your own research.